|
All 5 books, Edward Tufte paperback $180
All 5 clothbound books, autographed by ET $280
Visual Display of Quantitative Information
Envisioning Information
Visual Explanations
Beautiful Evidence
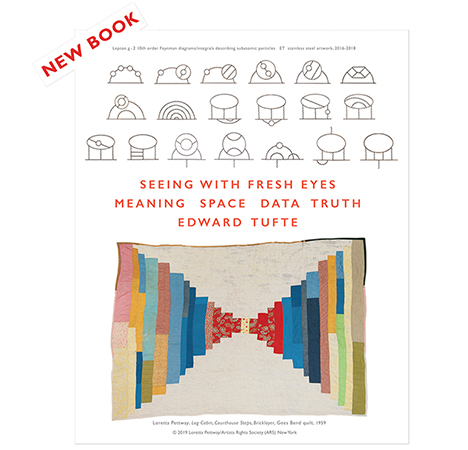
Seeing With Fresh Eyes
catalog + shopping cart
|
Edward Tufte e-books Immediate download to any computer: Visual and Statistical Thinking $5
The Cognitive Style of Powerpoint $5
Seeing Around + Feynman Diagrams $5
Data Analysis for Politics and Policy $9
catalog + shopping cart
New ET Book
Seeing with Fresh Eyes:
catalog + shopping cart
Meaning, Space, Data, Truth |
Analyzing/Presenting Data/Information All 5 books + 4-hour ET online video course, keyed to the 5 books. |

In The Visual Display of Quantitative Information, a stem-and-leaf plot is shown of volcanoe heights (page 46 in the 2nd edition).
I can't figure out why the digits on the right hand side of the chart aren't sorted. It seems like sorting this would make it easier to see how many volcanoes are 7,800 or taller, rather than just how many volcanoes are in the 7,000-7,900 foot range.
Is this chart example just not optimal, or am I missing something?
thanks...mike
-- Mike Combs (email)
Response to Stem & leaf displays, sorting rows
In the late 1960s John Tukey made the stem-and-leaf graphic by hand from an almanac that showed the volcano heights listed probably alphabetically. And so after finding the range of the data, and settling on intervals, John simply wrote down the next signficant digit on the leaves. Nowadays we would ask to the computer to sort the leaves in each bin in order. Such hand-drawn graphics are characteristic of John's graphical work that appeared in the article cited below (a great paper) and in Exploratory Data Analysis (EDA).
Back in those days long ago at Princeton, I have an imprecise memory of either seeing John making the volcano stem-and-leaf plot by hand or, more likely, seeing an early EDA manuscript with the plot in John's handwriting. Here is my account of the graphic in The Visual Display of Quantitative Information, page 140:
 |
-- Edward Tufte
I've figured it out. In the source, the volcanos were ordered by height, but also grouped by region, i.e. Africa, Europe etc. Hence the descending ranges.
My full "research": http://ilyabirman.net/meanwhile/all/tufte-mystery/

-- Ilya Birman (email)
|
||||||||